

如何使用Python创建条形图追赶动画
前言
动画是使可视化更具吸引力和用户吸引力的好方法。它帮助我们以有意义的方式展示数据可视化。Python 帮助我们使用现有的强大 Python 库创建动画可视化。Matplotlib是一个非常流行的数据可视化库,通常用于数据的图形表示以及使用内置函数的动画。
使用 Matplotlib 创建动画有两种方法:
使用 pause() 函数
使用 FuncAnimation() 函数
方法一:使用 pause() 函数
在暂停()的matplotlib库的pyplot模块在功能上用于暂停为参数提到间隔秒。考虑下面的示例,我们将使用 matplotlib 创建一个简单的线性图并在其中显示动画:
创建 2 个数组 X 和 Y,并存储从 1 到 100 的值。
使用 plot() 函数绘制 X 和 Y。
以合适的时间间隔添加 pause() 函数
运行程序,你会看到动画。
Python
    from matplotlib import pyplot as plt

x = []
y = []

for i in range(100):
    x.append(i)
    y.append(i)

    # 提及 x 和 y 限制以定义其范围
    plt.xlim(0, 100)
    plt.ylim(0, 100)

    # 绘制图形
    plt.plot(x, y, color = 'green')
    plt.pause(0.01)

plt.show()
输出 :
同样,你也可以使用 pause() 函数在各种绘图中创建动画。
方法二:使用 FuncAnimation() 函数
这个FuncAnimation() 函数不会自己创建动画,而是从我们传递的一系列图形中创建动画。
语法: FuncAnimation(figure, animation_function, frames=None, init_func=None, fargs=None, save_count=None, *, cache_frame_data=True,
**kwargs)
现在您可以使用 FuncAnimation 函数制作多种类型的动画:
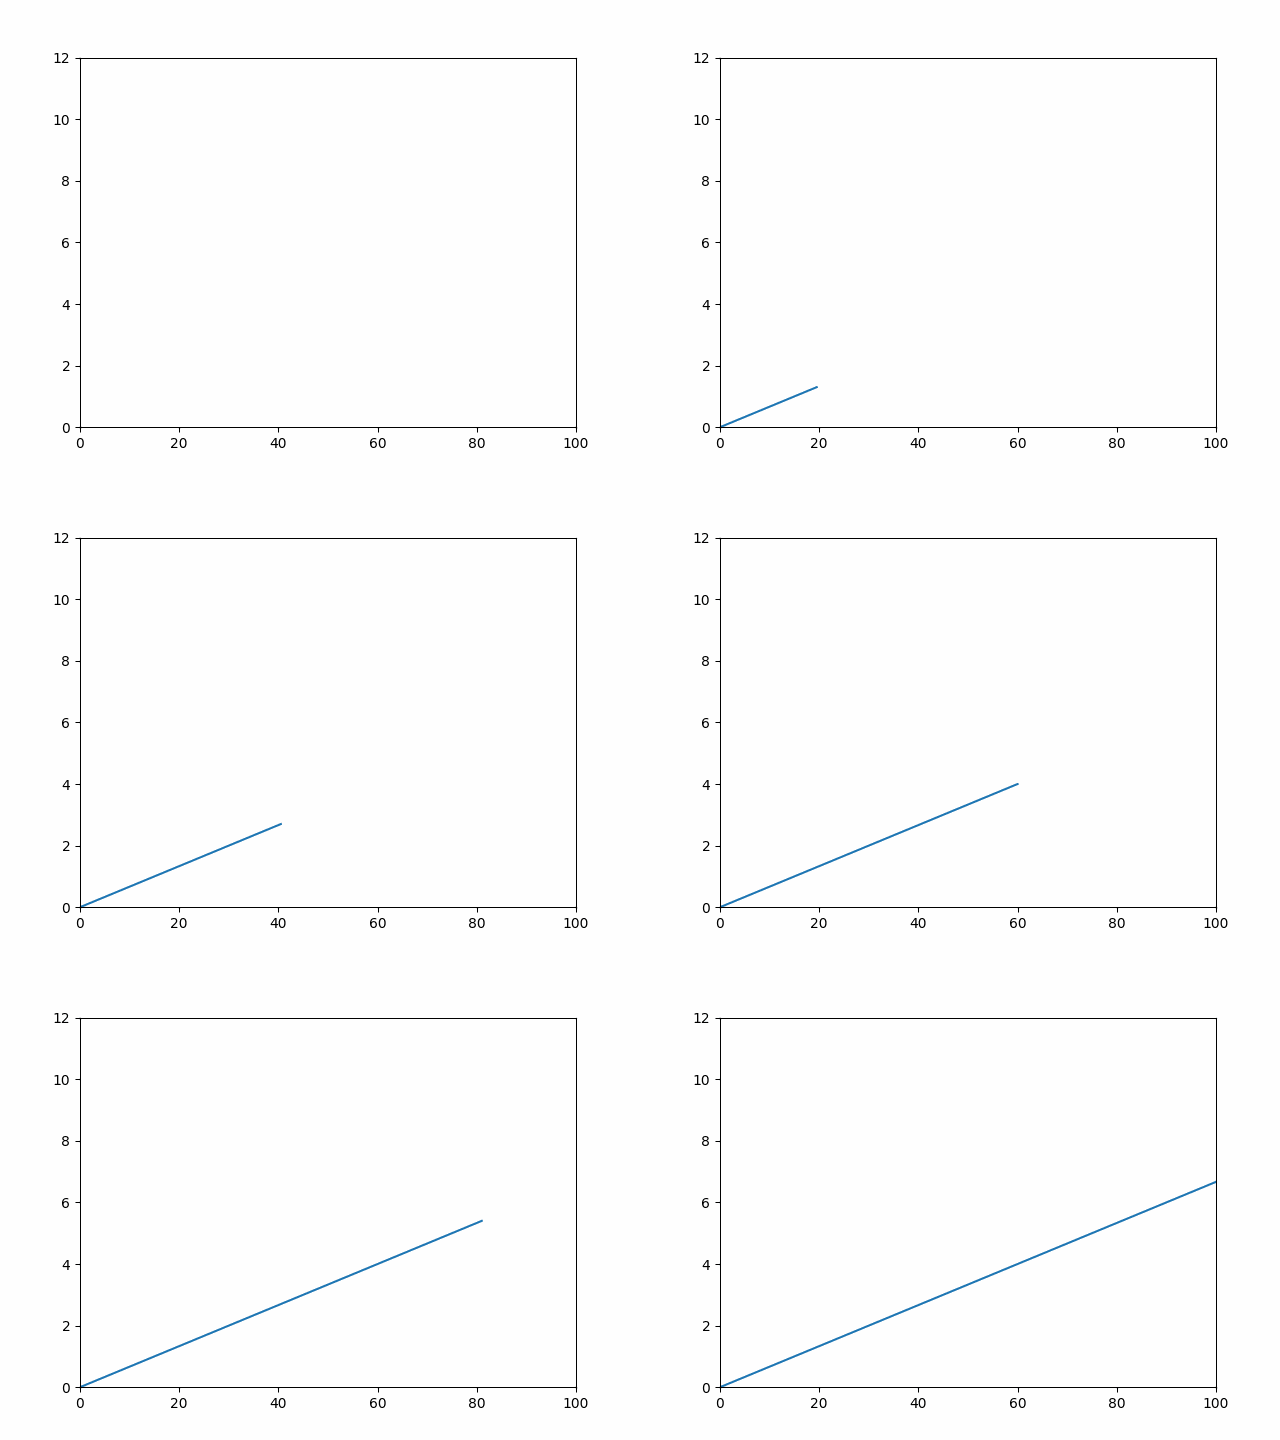
线性图动画
在这个例子中,我们将创建一个简单的线性图,它将显示一条线的动画。同样,使用 FuncAnimation,我们可以创建多种类型的动画视觉表示。我们只需要在一个函数中定义我们的动画,然后用合适的参数将它传递给FuncAnimation。
Python
    from matplotlib import pyplot as plt
from matplotlib.animation import FuncAnimation
import numpy as np

x = []
y = []

figure, ax = plt.subplots()

# 设置 x 和 y 轴的限制
ax.set_xlim(0, 100)
ax.set_ylim(0, 12)

# 绘制单个图形
line,  = ax.plot(0, 0)

def animation_function(i):
    x.append(i * 15)
    y.append(i)

    line.set_xdata(x)
    line.set_ydata(y)
    return line,

animation = FuncAnimation(figure,
                          func = animation_function,
                          frames = np.arange(0, 10, 0.1),
                          interval = 10)
plt.show()
输出:
Python 中的条形图追赶动画
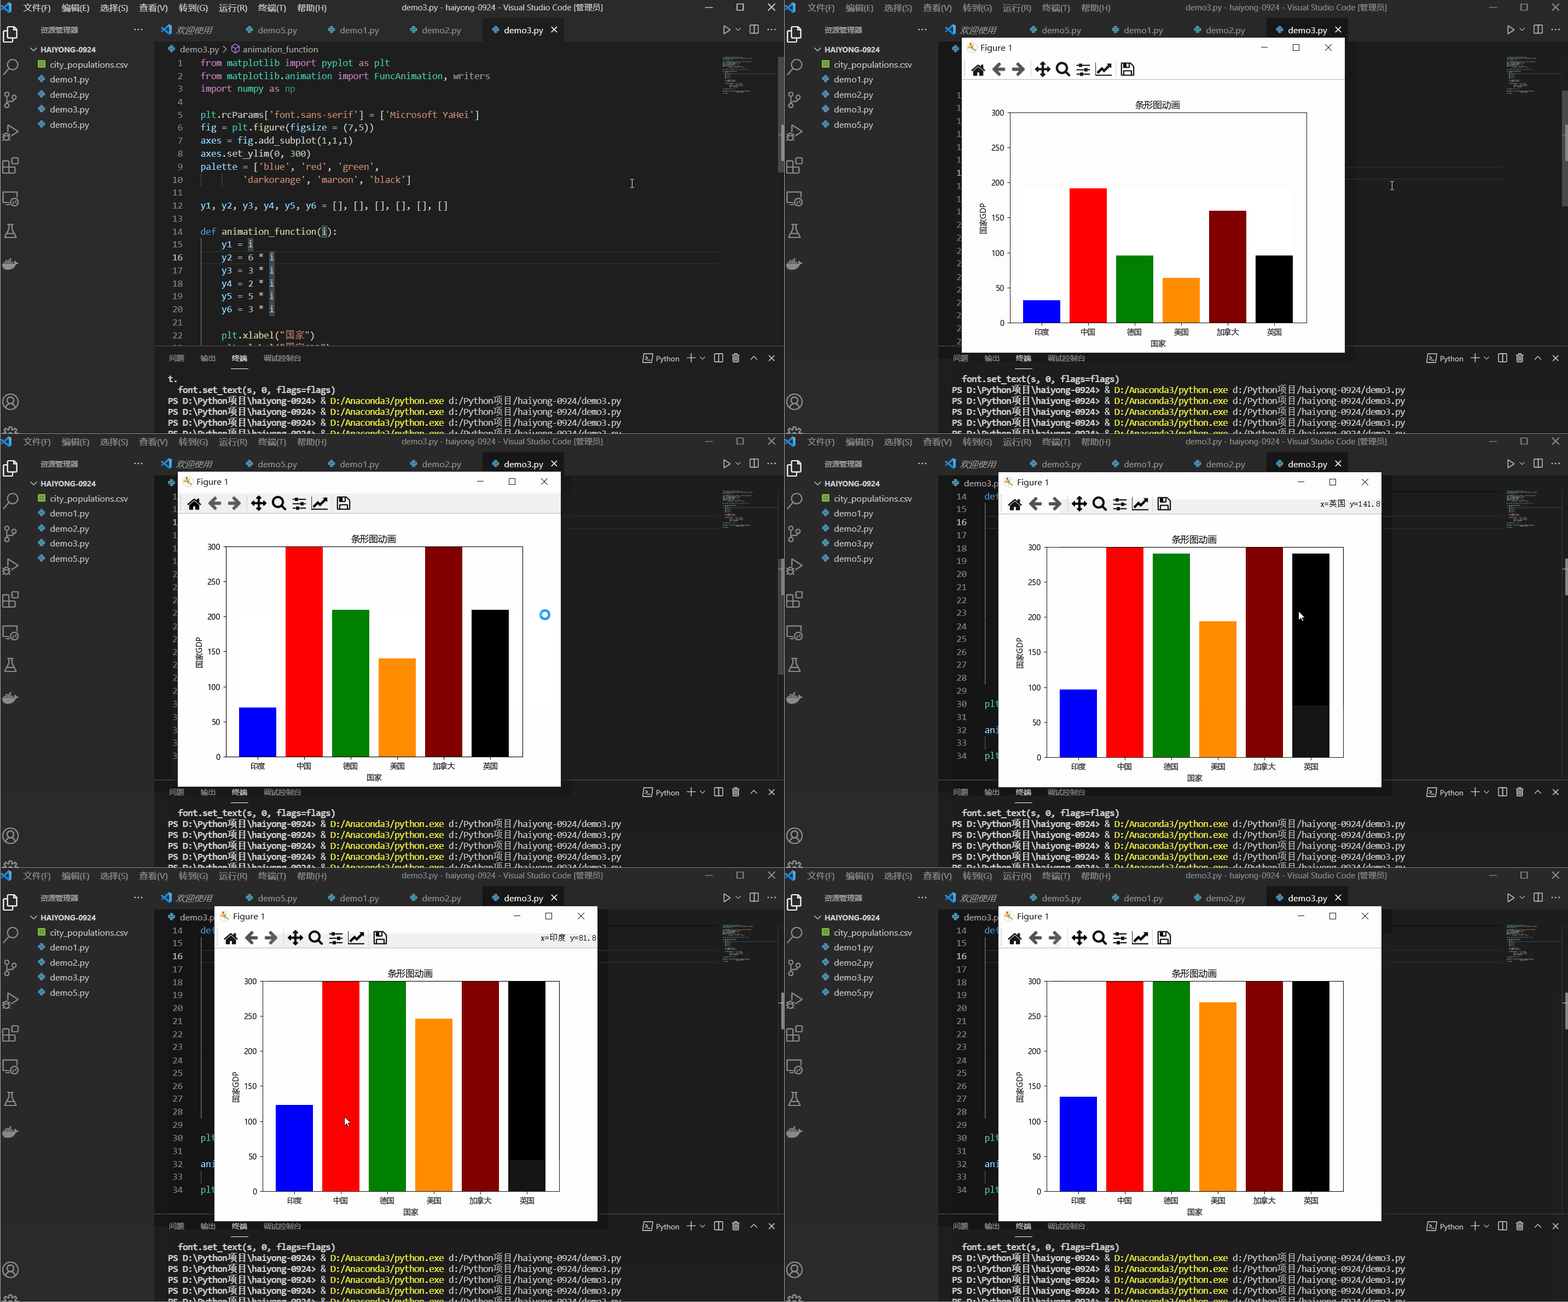
在此示例中,我们将创建一个简单的条形图动画,它将显示每个条形的动画。
Python
    from matplotlib import pyplot as plt
from matplotlib.animation import FuncAnimation, writers
import numpy as np

plt.rcParams['font.sans-serif'] = ['Microsoft YaHei']
fig = plt.figure(figsize = (7,5))
axes = fig.add_subplot(1,1,1)
axes.set_ylim(0, 300)
palette = ['blue', 'red', 'green',
		'darkorange', 'maroon', 'black']

y1, y2, y3, y4, y5, y6 = [], [], [], [], [], []

def animation_function(i):
	y1 = i
	y2 = 6 * i
	y3 = 3 * i
	y4 = 2 * i
	y5 = 5 * i
	y6 = 3 * i

	plt.xlabel("国家")
	plt.ylabel("国家GDP")

	plt.bar(["印度", "中国", "德国",
			"美国", "加拿大", "英国"],
			[y1, y2, y3, y4, y5, y6],
			color = palette)

plt.title("条形图动画")

animation = FuncAnimation(fig, animation_function,
						interval = 50)
plt.show()
输出:
Python 中的散点图动画:
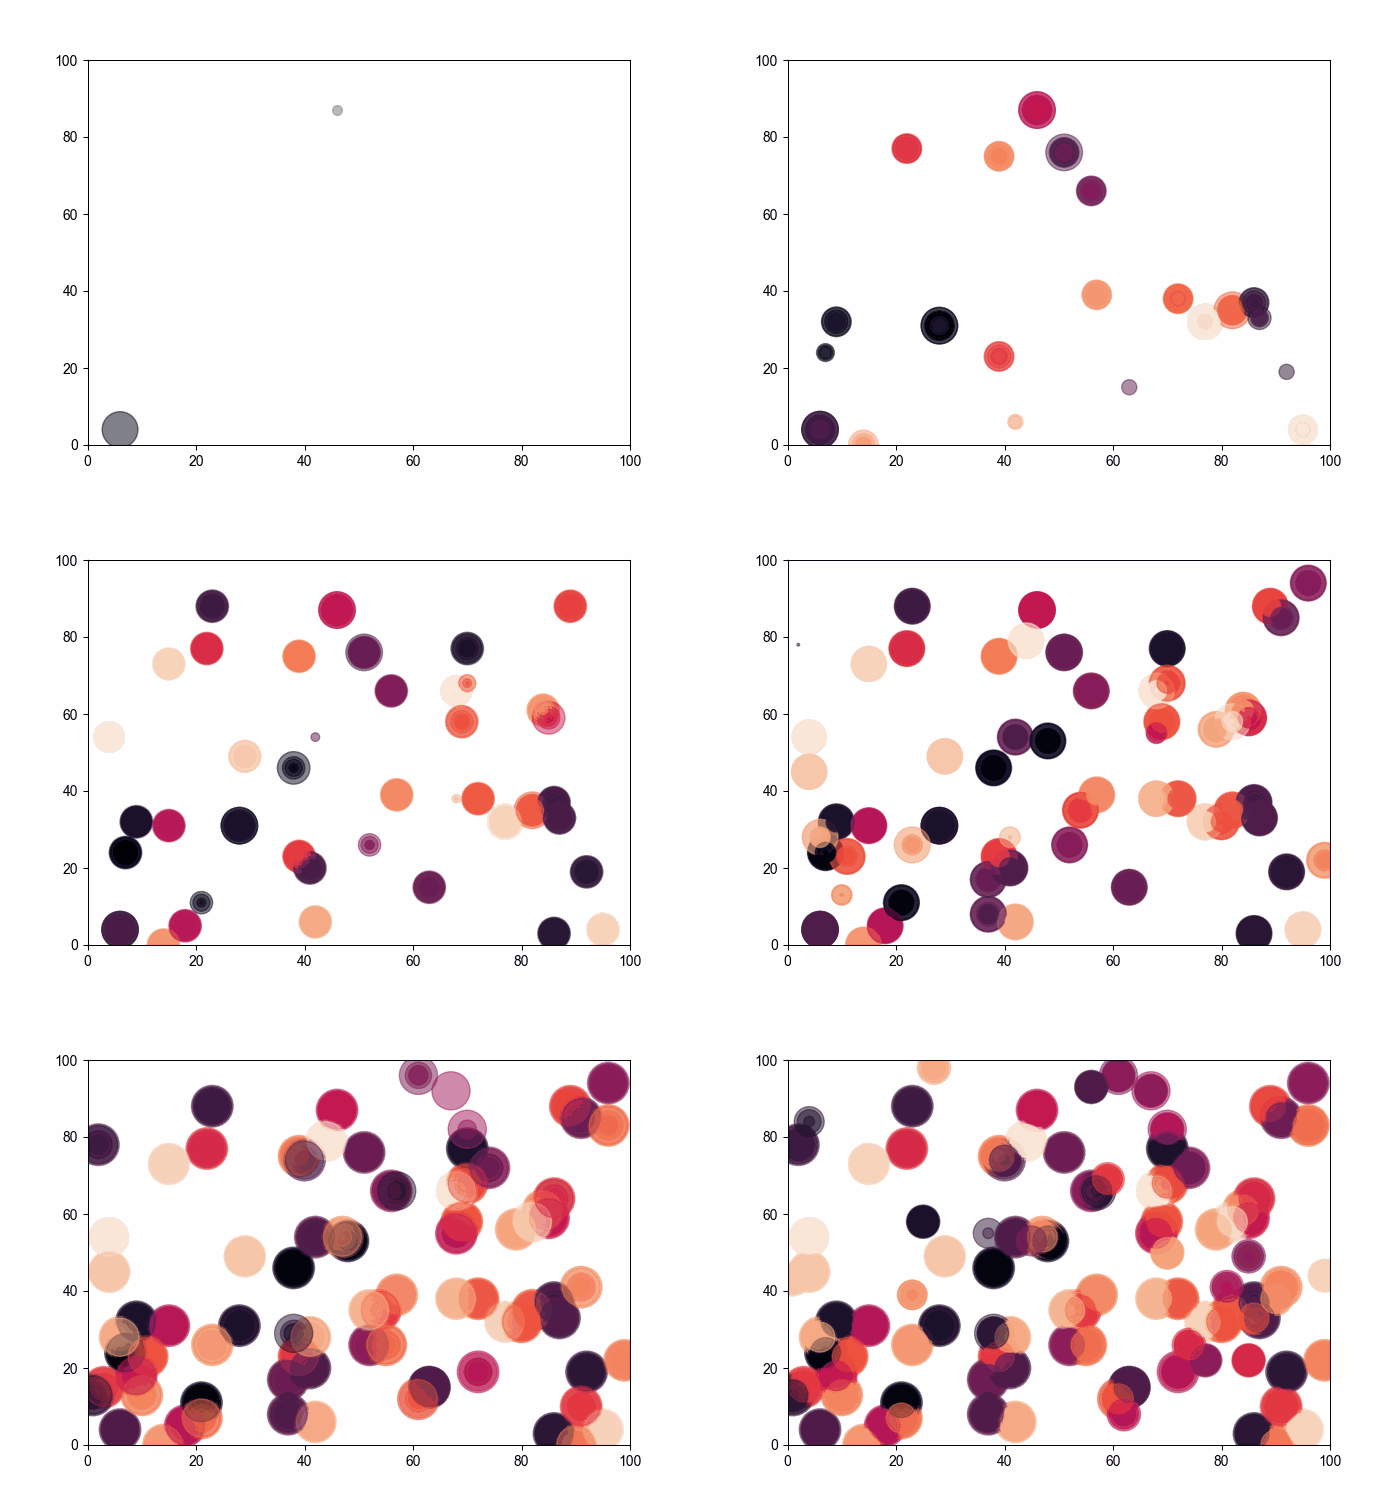
在这个例子中,我们将使用随机函数在 python 中动画散点图。我们将遍历animation_func并在迭代时绘制 x 和 y 轴的随机值。
    from matplotlib import pyplot as plt
from matplotlib.animation import FuncAnimation
import random
import numpy as np

x = []
y = []
colors = []
fig = plt.figure(figsize=(7,5))

def animation_func(i):
	x.append(random.randint(0,100))
	y.append(random.randint(0,100))
	colors.append(np.random.rand(1))
	area = random.randint(0,30) * random.randint(0,30)
	plt.xlim(0,100)
	plt.ylim(0,100)
	plt.scatter(x, y, c = colors, s = area, alpha = 0.5)

animation = FuncAnimation(fig, animation_func,
						interval = 100)
plt.show()
输出:
条形图追赶的水平移动
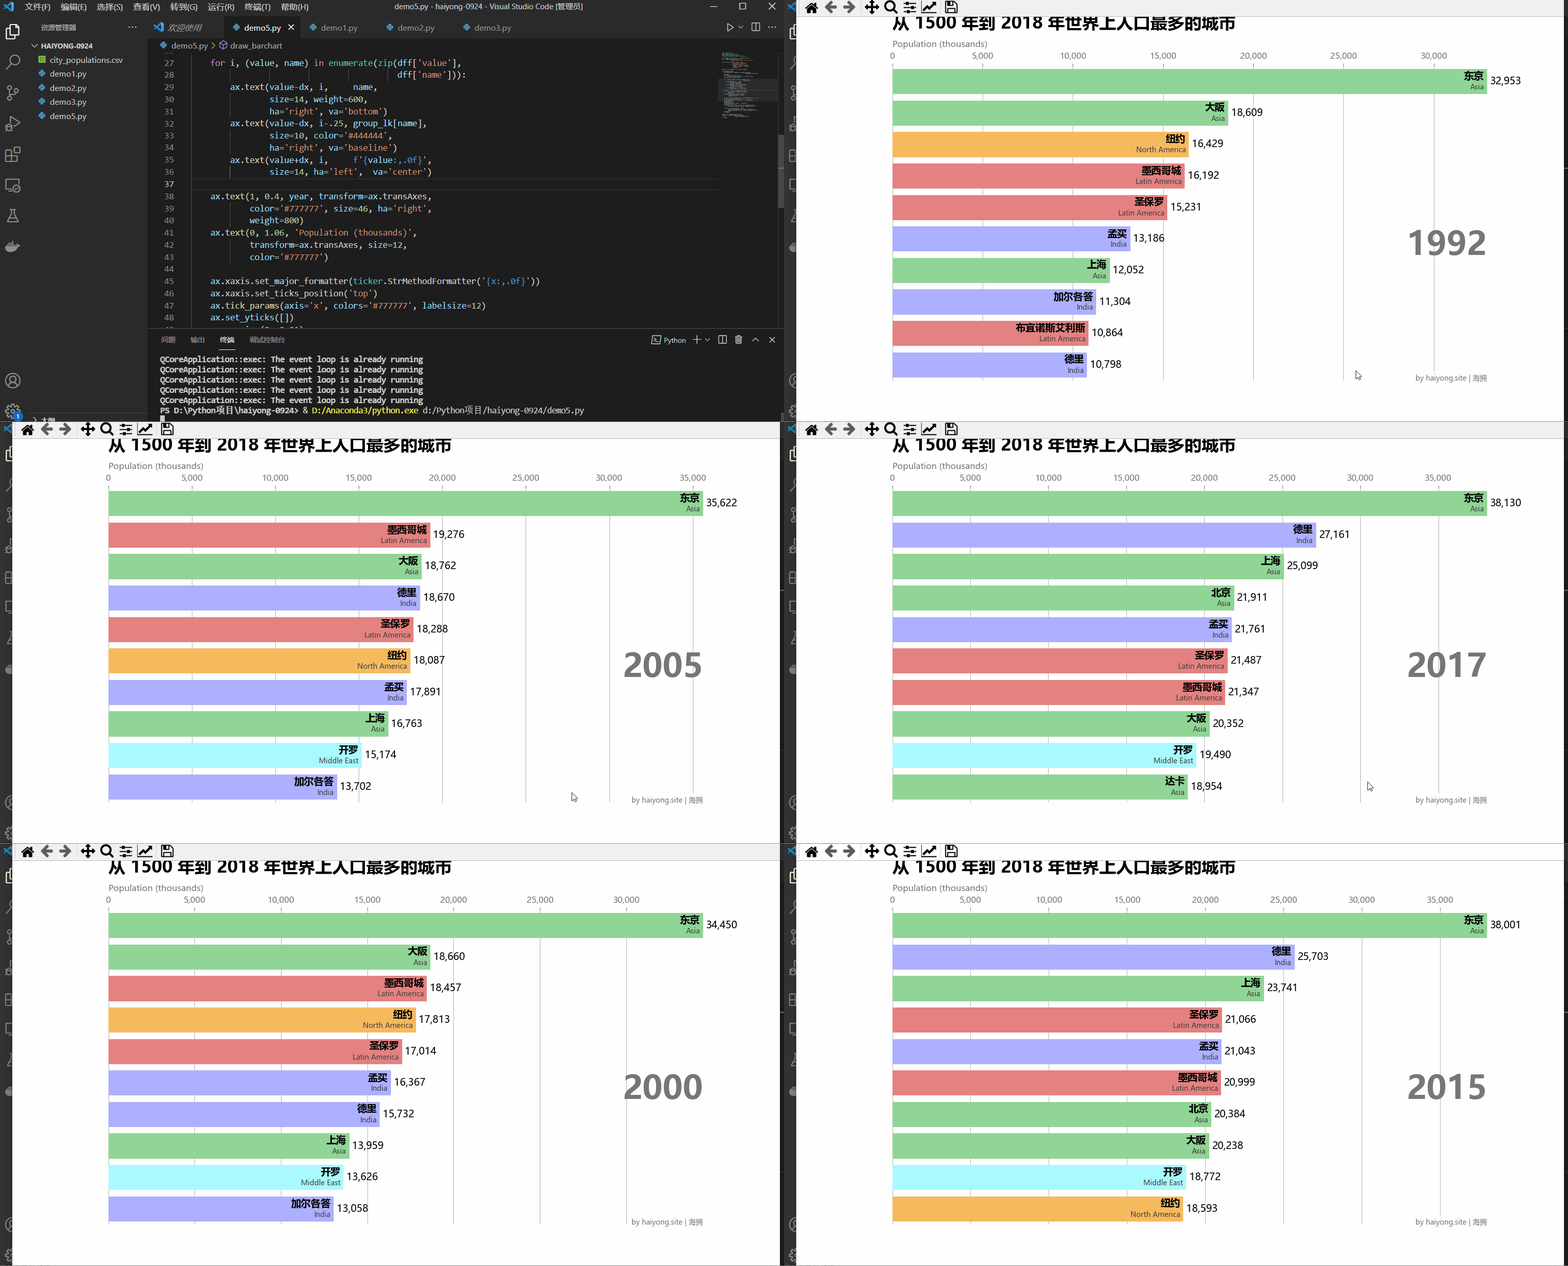
在这里,我们将使用城市数据集中的最高人口绘制条形图竞赛。
不同的城市会有不同的条形图,条形图追赶将从 1990 年到 2018 年迭代。
我从人口最多的数据集中选择了最高城市的国家。
需要用到的数据集可以从这里下载:city_populations
Python
    import pandas as pd
import matplotlib.pyplot as plt
import matplotlib.ticker as ticker
from matplotlib.animation import FuncAnimation

plt.rcParams['font.sans-serif'] = ['Microsoft YaHei']
df = pd.read_csv('city_populations.csv',
                 usecols=['name', 'group', 'year', 'value'])

colors = dict(zip(['India','Europe','Asia',
                   'Latin America','Middle East',
                   'North America','Africa'],
                    ['#adb0ff', '#ffb3ff', '#90d595',
                     '#e48381', '#aafbff', '#f7bb5f',
                     '#eafb50']))

group_lk = df.set_index('name')['group'].to_dict()

def draw_barchart(year):
    dff = df[df['year'].eq(year)].sort_values(by='value',
                                              ascending=True).tail(10)
    ax.clear()
    ax.barh(dff['name'], dff['value'],
            color=[colors[group_lk[x]] for x in dff['name']])
    dx = dff['value'].max() / 200

    for i, (value, name) in enumerate(zip(dff['value'],
                                          dff['name'])):
        ax.text(value-dx, i,     name,
                size=14, weight=600,
                ha='right', va='bottom')
        ax.text(value-dx, i-.25, group_lk[name],
                size=10, color='#444444',
                ha='right', va='baseline')
        ax.text(value+dx, i,     f'{value:,.0f}',
                size=14, ha='left',  va='center')

    ax.text(1, 0.4, year, transform=ax.transAxes,
            color='#777777', size=46, ha='right',
            weight=800)
    ax.text(0, 1.06, 'Population (thousands)',
            transform=ax.transAxes, size=12,
            color='#777777')

    ax.xaxis.set_major_formatter(ticker.StrMethodFormatter('{x:,.0f}'))
    ax.xaxis.set_ticks_position('top')
    ax.tick_params(axis='x', colors='#777777', labelsize=12)
    ax.set_yticks([])
    ax.margins(0, 0.01)
    ax.grid(which='major', axis='x', linestyle='-')
    ax.set_axisbelow(True)
    ax.text(0, 1.12, '从 1500 年到 2018 年世界上人口最多的城市',
            transform=ax.transAxes, size=24, weight=600, ha='left')

    ax.text(1, 0, 'by haiyong.site | 海拥',
            transform=ax.transAxes, ha='right', color='#777777',
            bbox=dict(facecolor='white', alpha=0.8, edgecolor='white'))
    plt.box(False)
    plt.show()

fig, ax = plt.subplots(figsize=(15, 8))
animator = FuncAnimation(fig, draw_barchart,
                         frames = range(1990, 2019))
plt.show()
输出:
下一篇:SQL性能优化有哪些措施