

在vue项目中如何引用Antv G2
创始人
2024-11-17 19:02:26
0次
template内容:
js部分:
//引入G2组件
import G2 from "@antv/g2";
export default {
name:"",
//数据部分
data(){
return{
sourceData: [],//声明一个数组
chart: {}, //全局定义chart对象
id: Math.random().toString(36).substr(2), //动态生成ID,便于多次引用
}
},
//初始加载
mounted() {
this.initComponent();
},
methods: {
//初始化获取数据
initStrateGoal() {
debugger;
let _this = this;
_this.$http
.$get("后台接口地址")
.then(function(response) {
if (_this.$util.isBlank(response.data)) {
return;
}
_this.sourceData = response.data;
//调用绘图方法
_this.getDrawing(_this.sourceData);
})
.catch(function(error) {
_this.$message.error(_this, error);
});
},
//绘制图形
getDrawing(sourceData) {
let _this = this;
// Step 1: 创建 Chart 对象
_this.chart = new G2.Chart({
container: _this.id,
forceFit: true,
height: 255,
padding: [30, 0, 35, 0],
animate: false
// margin: [0, 500]
});
let sumCount = 0;
for (let i in sourceData) {
sumCount = sumCount + Number(sourceData[i].count);
}
// Step 2: 载入数据源
_this.chart.source(sourceData, {
percent: {
formatter: function formatter(val) {
val = val + "%";
return val;
}
}
});
_this.chart.coord("theta", {
radius: 0.75,
innerRadius: 0.6
});
//消息提示
_this.chart.tooltip({
showTitle: false,
itemTpl:
'目标总数
' + sumCount + "
",
alignX: "middle",
alignY: "middle"
});
// Step 3:创建图形语法,绘制饼图
var interval = _this.chart
.intervalStack()
.position("percent")
.color("item")
.label("percent", {
formatter: function formatter(val, item) {
return item.point.item + ": " + val;
}
})
.tooltip("item*percent", function(item, percent) {
//数据显示为百分比形式
percent = percent + "%";
return {
name: item,
value: percent
};
})
.style({
lineWidth: 1,
stroke: "#fff"
});
// Step 4:最后一步渲染至画布
_this.chart.render();
//初始加载图片后默认显示第一个条目突起,点击后进行变更
interval.setSelected(sourceData[0]);
},
//因为父级页面用的事Tab调用,会有显示不全的现象发生,所以销毁所有对象后重新加载
reloadDrawing() {
//销毁画布对象
this.chart.destroy();
//重新调用数据进行加载
this.initStrateGoal();
}
}
}' + sumCount + "
*父级页面时tab调用,并且是一个页面多次引用,有两个坑
1.tab点击时,有的页面显示不全,样式也有问题,需要销毁重构(只是我的个人方案,有其他方案的话可以推荐)
2.一个页面有多个图表,id是不能重复的,必须动态生成
补充知识:vue+antv与数据库交互实现数据可视化图表
一、安装antv
npm install @antv/g2
二、在官网选择自己需要的图表
https://g2.antv.vision/zh/examples/gallery
这里以这个图为例
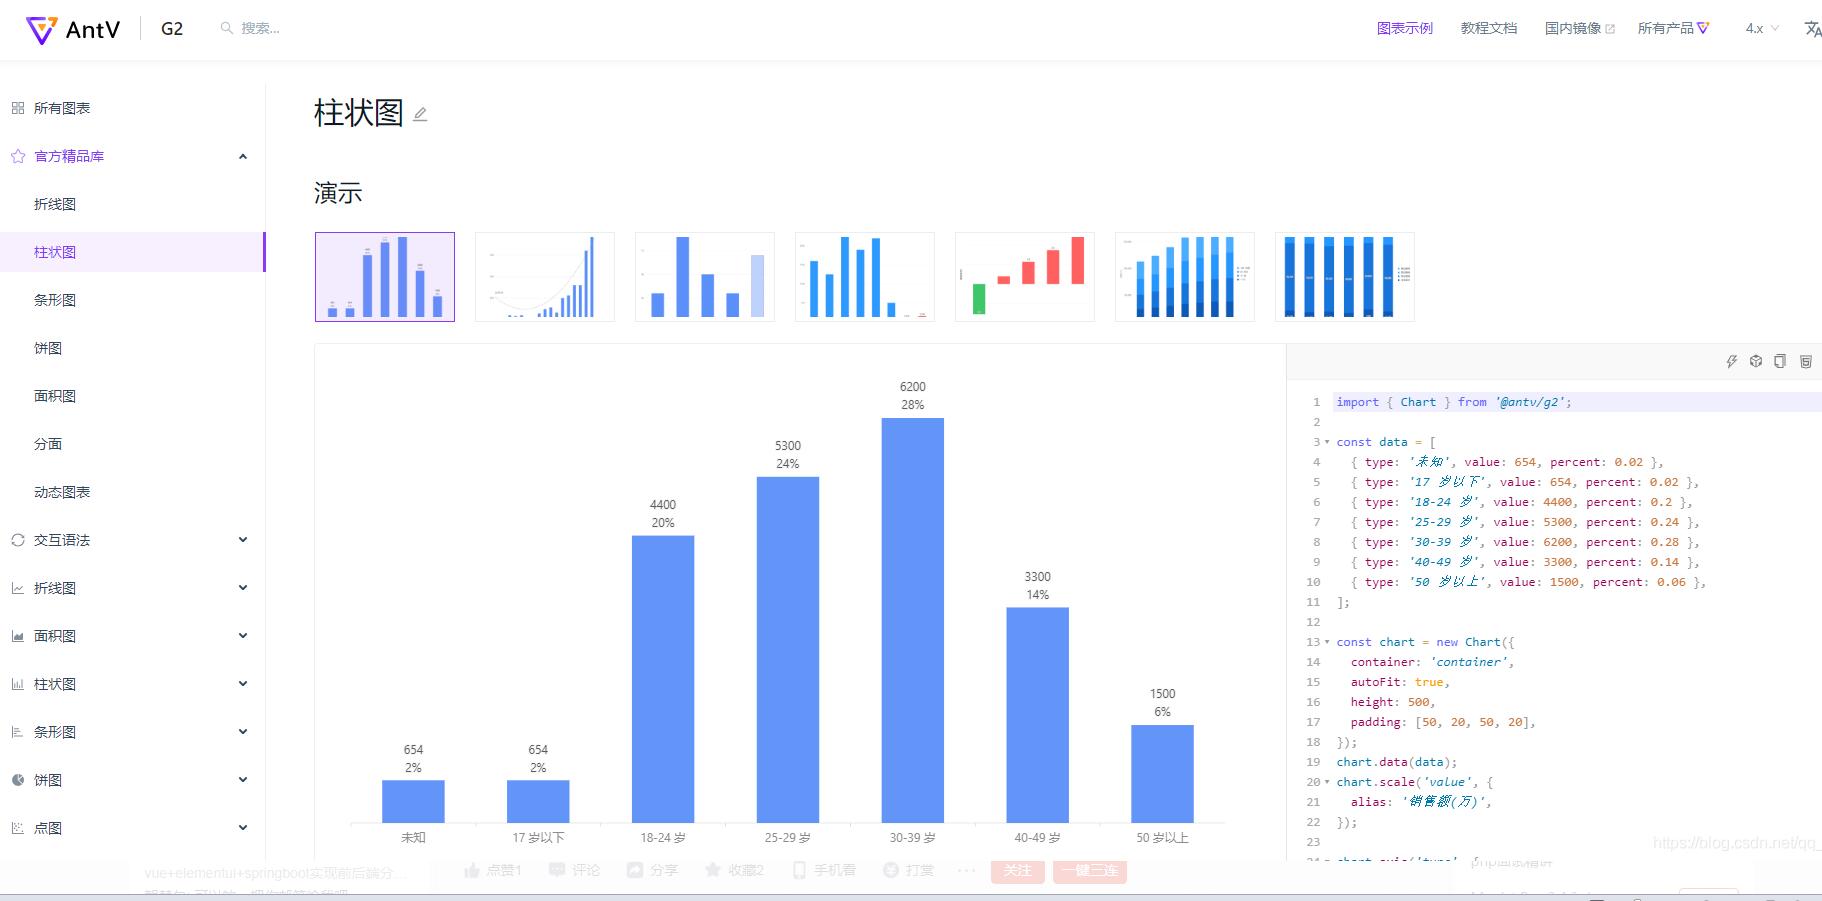
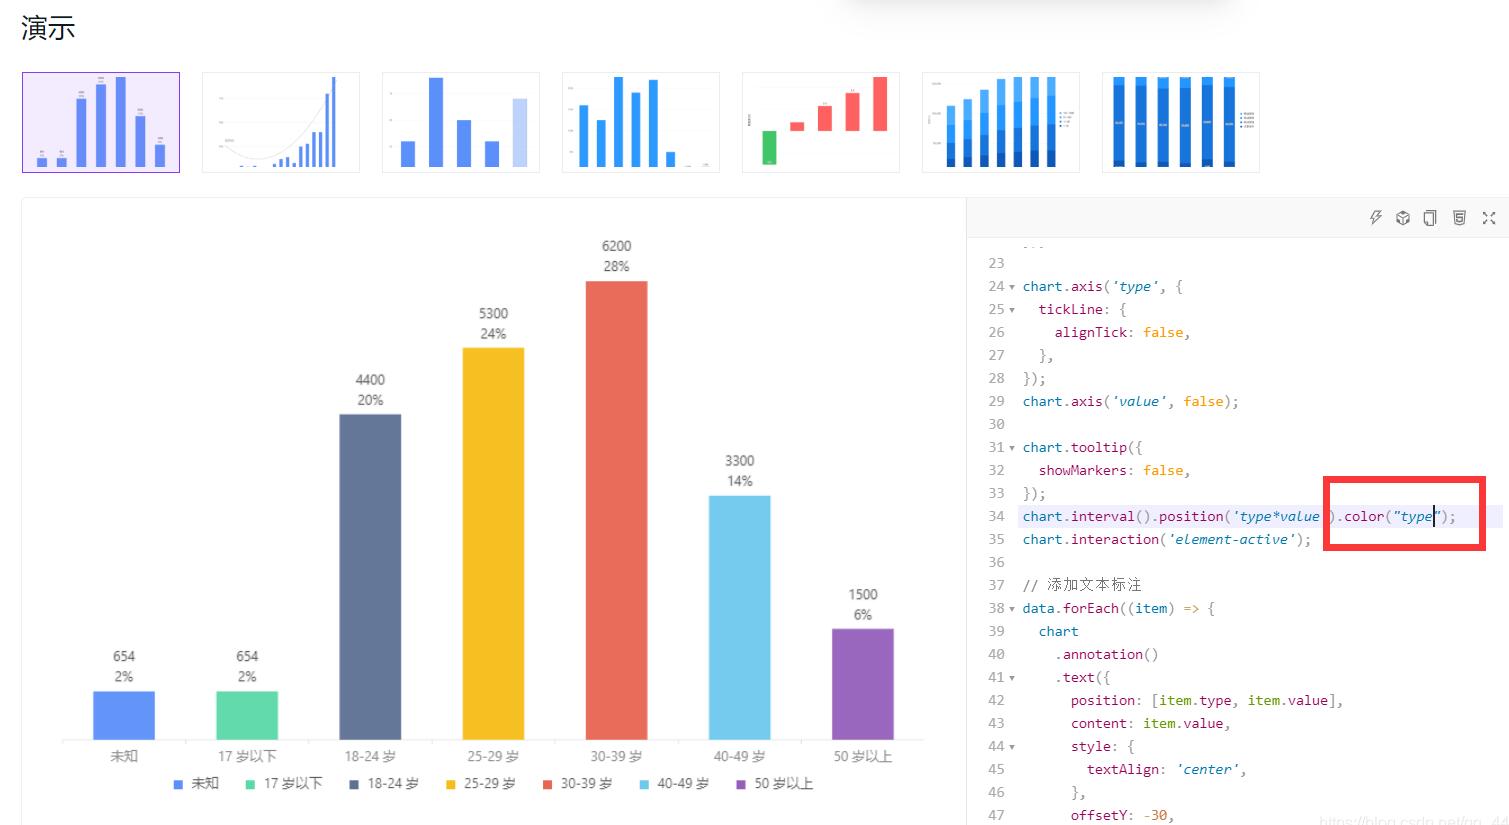
右侧就是实现这个图的代码,在这里加上.color(“type”)即可根据字段名显示不同的颜色
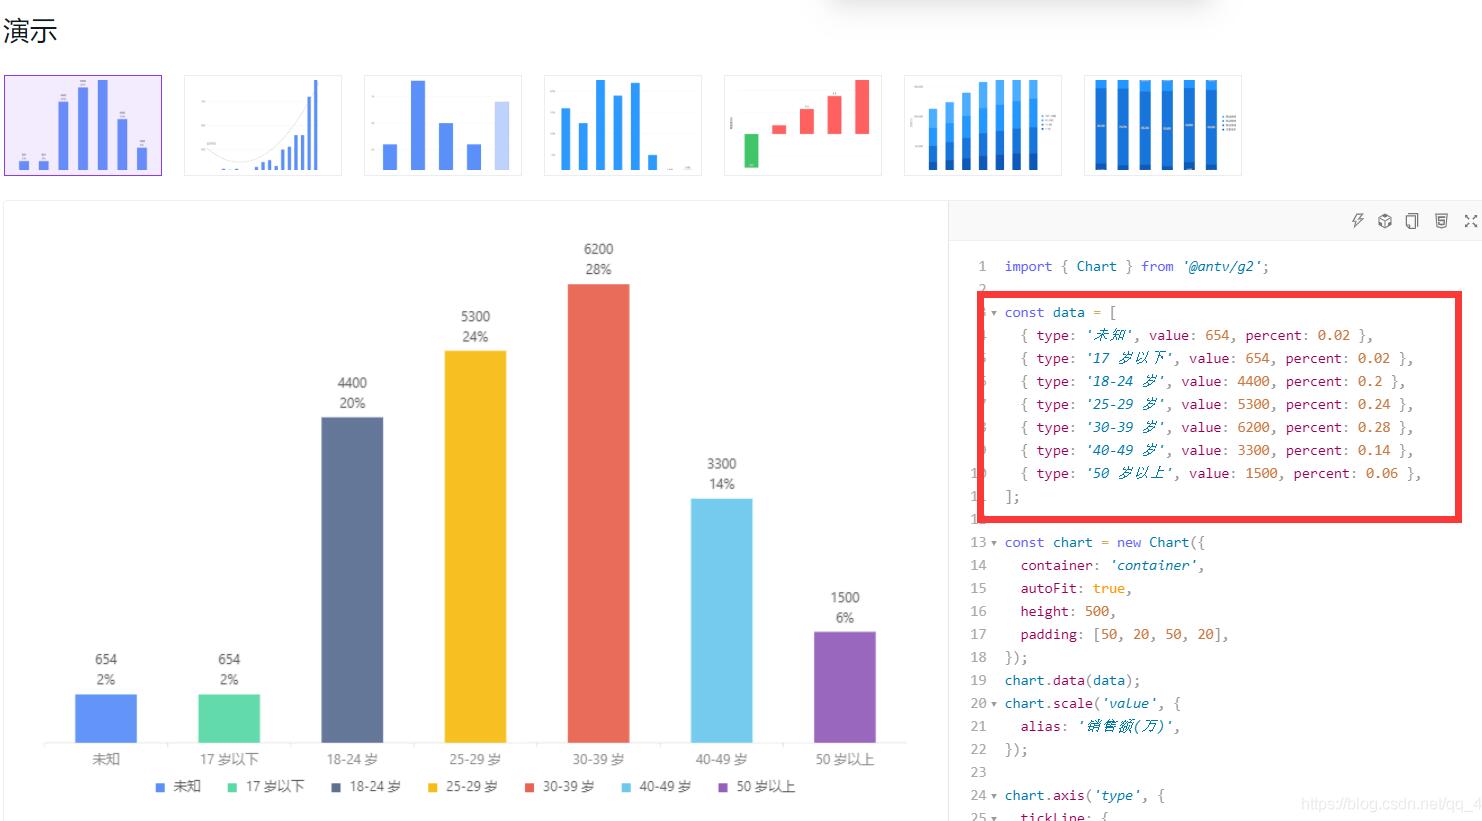
这里数据的字段和值可以按需更改(更改字段名称的话要把下面相关的字段名全部替换)
三、整合vue antv
在vue中引入antv
import { Chart } from "@antv/g2";
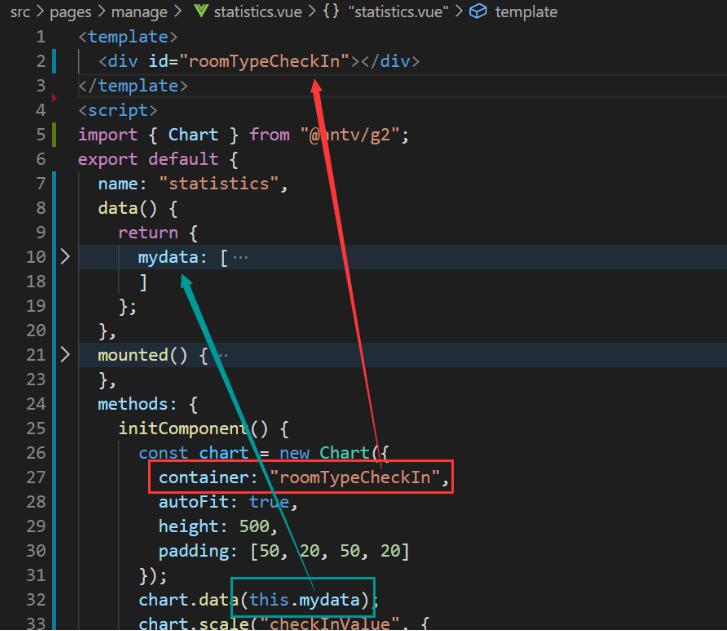
指定一个容器来放图表
替换默认的data数据
data() {
  return {
   mydata: [
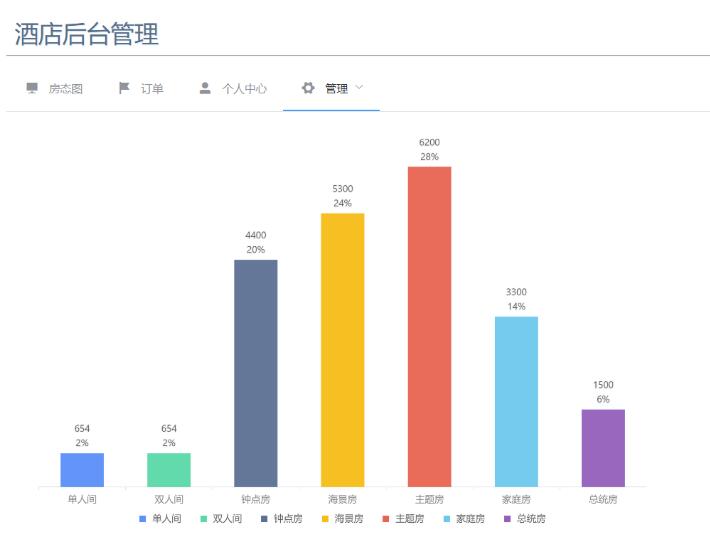
    { roomTypeName: "单人间", checkInValue: 654, checkInPercent: 0.02 },
    { roomTypeName: "双人间", checkInValue: 654, checkInPercent: 0.02 },
    { roomTypeName: "钟点房", checkInValue: 4400, checkInPercent: 0.2 },
    { roomTypeName: "海景房", checkInValue: 5300, checkInPercent: 0.24 },
    { roomTypeName: "主题房", checkInValue: 6200, checkInPercent: 0.28 },
    { roomTypeName: "家庭房", checkInValue: 3300, checkInPercent: 0.14 },
    { roomTypeName: "总统房", checkInValue: 1500, checkInPercent: 0.06 }
   ]
  };
 },
把绘图代码复制进来
此处需要把默认的container:‘container' 修改为自己指定的容器id,渲染数据时,将data修改为this.xxx(自己定义的数据名称),不同的图修改的地方可能会不同
methods: {
  initComponent() {
   const chart = new Chart({
    container: "roomTypeCheckIn",
    autoFit: true,
    height: 500,
    padding: [50, 20, 50, 20]
   });
   chart.data(this.mydata);
   chart.scale("checkInValue", {
    alias: "销售额"
   });

   chart.axis("roomTypeName", {
    tickLine: {
     alignTick: false
    }
   });
   chart.axis("checkInValue", false);

   chart.tooltip({
    showMarkers: false
   });
   chart
    .interval()
    .position("roomTypeName*checkInValue")
    .color("roomTypeName");
   chart.interaction("element-active");

   // 添加文本标注
   this.mydata.forEach(item => {
    chart
     .annotation()
     .text({
      position: [item.roomTypeName, item.checkInValue],
      content: item.checkInValue,
      style: {
       textAlign: "center"
      },
      offsetY: -30
     })
     .text({
      position: [item.roomTypeName, item.checkInValue],
      content: (item.checkInPercent * 100).toFixed(0) + "%",
      style: {
       textAlign: "center"
      },
      offsetY: -12
     });
   });
   chart.render();
  }
 }
在mounted函数中调用绘图方法
 mounted() {
  this.initComponent();
 },
启动项目即可看到最终效果
三、与数据库交互
添加一个获取数据的方法(按自己的接口进行相应的替换)
getData() {
   roomTypeApi.getRoomTypeStatistics().then(res => {
    this.mydata = res.data.data
   })
  },
在created函数中调用获取数据的函数
 created() {
   this.getData()
 },
在watch函数中监听数据,数据发生变化时重新渲染图表
 watch: {
  mydata(b,a) {
    this.chart.changeData(b)
    this.chart.render()
  }
 },
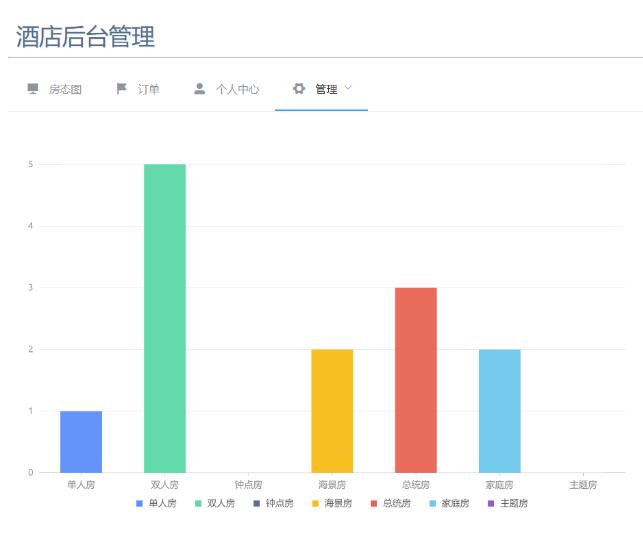
最后得到的图表数据就是数据库中的数据了
相关内容
热门资讯
空调连续工作多久需要停机休息
空调连续工作的时间取决于多个因素,包括空调的型号、功率、使用环境和维护情况等。一般来说,空调可以连续...
空调哪个符号是除湿的
空调除湿功能通常用一个水滴形状的符号表示。不同品牌和型号的空调遥控器可能会有所差异,但一般来说,除湿...
格力空调多长时间加一次氟利昂
1、一般情况下,空调对氟利昂的使用量是非常小的,所以在空调使用了四年左右的时候再考虑加也没问题。2、...
空调用多长时间需要加氟一次
一般情况下是五年。当出现以下这几种情况时,空调才需要加氟。1、空调的室内机和室外机各有两个接口,当接...
格调生活·C标思享荟:卡萨帝在...
9月12日的郑州龙湖金融岛,夜风轻拂,灯光璀璨。“C标时刻共传奇——卡萨帝思享荟暨20周年品牌盛典郑...
品牌价值破千亿、高端份额持续领...
9月12日,“C标时刻共传奇——卡萨帝思享荟暨20周年品牌盛典郑州站”在郑州龙湖金融岛举办。2026...
空调主板坏了修800还是换新的
空调主板坏了是修还是换新,需要考虑多个因素,以下是一些建议:1. 维修成本:如果维修费用较低,比如 ...
空调开多久需要休息多长时间
问题:空调开多久需要休息多长时间回答:1、在使用空调的过程中,一般空调开7~8个小时左右需要休息2~...
中央空调多长时间清洗一次
1、一般空调开机前清洗一次即可,空调开机中间时段再清洗一次,空调关机时清洗一次,这样比较合理。2、空...
中央空调氟利昂多久加一次
看空调制热和制冷程度,很多人的观点认为氟利昂必须一年放一次,其实这个观点是错误的,理解上面有点偏差,...