

使用Python绘图实现台风路径可视化
创始人
2024-11-17 09:22:37
0次
台风是重大灾害性天气,台风引起的直接灾害通常由三方面造成,狂风、暴雨、风暴潮,除此以外台风的这些灾害极易诱发城市内涝、房屋倒塌、山洪、泥石流等次生灾害。正因如此,台风在科研和业务工作中是研究的重点。希望这次台风路径可视化可以给予大家一点点帮助。
台风路径的获取
中国气象局(CMA)
中国气象局(CMA)的台风最佳路径数据集(BST),BST是之后对历史台风路径进行校正后发布的,其经纬度、强度、气压具有更高的可靠性,但是时间分辨率为6小时,部分3小时,这一点不如观测数据
导入模块并读取数据,使用BST的2018年台风路径数据作为示例,已经将原始的txt文件转换为xls文件。
import os, glob
import pandas as pd
import numpy as np
import shapely.geometry as sgeom
import matplotlib.pyplot as plt
from matplotlib.image import imread
from matplotlib.animation import FuncAnimation
import matplotlib.lines as mlines
import cartopy.crs as ccrs
import cartopy.feature as cfeat
from cartopy.mpl.ticker import LongitudeFormatter,LatitudeFormatter
import cartopy.io.shapereader as shpreader
import cartopy.io.img_tiles as cimgt
from PIL import Image
import warnings
warnings.filterwarnings('ignore')
df = pd.read_csv('./2018typhoon.csv')
定义等级色标
def get_color(level):
  global color
  if level == '热带低压' or level == '热带扰动':
    color='#FFFF00'
  elif level == '热带风暴':
    color='#6495ED'
  elif level == '强热带风暴':
    color='#3CB371'
  elif level == '台风':
    color='#FFA500'
  elif level == '强台风':
    color='#FF00FF'
  elif level == '超强台风':
    color='#DC143C'
  return color
定义底图函数
def create_map(title, extent):
  fig = plt.figure(figsize=(12, 8))
  ax = fig.add_subplot(1, 1, 1, projection=ccrs.PlateCarree())
  url = 'http://map1c.vis.earthdata.nasa.gov/wmts-geo/wmts.cgi'
  layer = 'BlueMarble_ShadedRelief'
  ax.add_wmts(url, layer)
  ax.set_extent(extent,crs=ccrs.PlateCarree())

  gl = ax.gridlines(draw_labels=False, linewidth=1, color='k', alpha=0.5, linestyle='--')
  gl.xlabels_top = gl.ylabels_right = False
  ax.set_xticks(np.arange(extent[0], extent[1]+5, 5))
  ax.set_yticks(np.arange(extent[2], extent[3]+5, 5))
  ax.xaxis.set_major_formatter(LongitudeFormatter())
  ax.xaxis.set_minor_locator(plt.MultipleLocator(1))
  ax.yaxis.set_major_formatter(LatitudeFormatter())
  ax.yaxis.set_minor_locator(plt.MultipleLocator(1))
  ax.tick_params(axis='both', labelsize=10, direction='out')

  a = mlines.Line2D([],[],color='#FFFF00',marker='o',markersize=7, label='TD',ls='')
  b = mlines.Line2D([],[],color='#6495ED', marker='o',markersize=7, label='TS',ls='')
  c = mlines.Line2D([],[],color='#3CB371', marker='o',markersize=7, label='STS',ls='')
  d = mlines.Line2D([],[],color='#FFA500', marker='o',markersize=7, label='TY',ls='')
  e = mlines.Line2D([],[],color='#FF00FF', marker='o',markersize=7, label='STY',ls='')
  f = mlines.Line2D([],[],color='#DC143C', marker='o',markersize=7, label='SSTY',ls='')
  ax.legend(handles=[a,b,c,d,e,f], numpoints=1, handletextpad=0, loc='upper left', shadow=True)
  plt.title(f'{title} Typhoon Track', fontsize=15)
  return ax
定义绘制单个台风路径方法,并绘制2018年第18号台风温比亚。
def draw_single(df):
  ax = create_map(df['名字'].iloc[0], [110, 135, 20, 45])
  for i in range(len(df)):
    ax.scatter(list(df['经度'])[i], list(df['纬度'])[i], marker='o', s=20, color=get_color(list(df['强度'])[i]))

  for i in range(len(df)-1):
    pointA = list(df['经度'])[i],list(df['纬度'])[i]
    pointB = list(df['经度'])[i+1],list(df['纬度'])[i+1]
    ax.add_geometries([sgeom.LineString([pointA, pointB])], color=get_color(list(df['强度'])[i+1]),crs=ccrs.PlateCarree())
  plt.savefig('./typhoon_one.png')
draw_single(df[df['编号']==1818])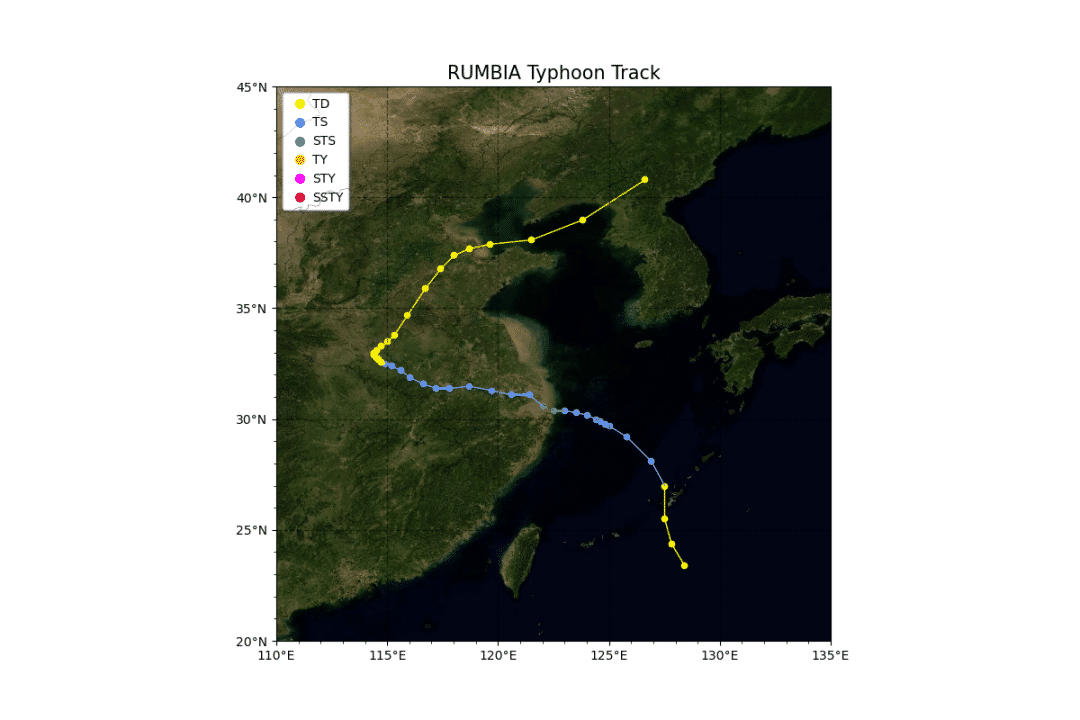
定义绘制多个台风路径方法,并绘制2018年全年的全部台风路径。
def draw_multi(df):
  L = list(set(df['编号']))
  L.sort(key=list(df['编号']).index)
  ax = create_map('2018', [100, 180, 0, 45])
  for number in L:
    df1 = df[df['编号']==number]
    for i in range(len(df1)-1):
      pointA = list(df1['经度'])[i],list(df1['纬度'])[i]
      pointB = list(df1['经度'])[i+1],list(df1['纬度'])[i+1]
      ax.add_geometries([sgeom.LineString([pointA, pointB])], color=get_color(list(df1['强度'])[i+1]),crs=ccrs.PlateCarree())
  plt.savefig('./typhoon_multi.png')
draw_multi(df)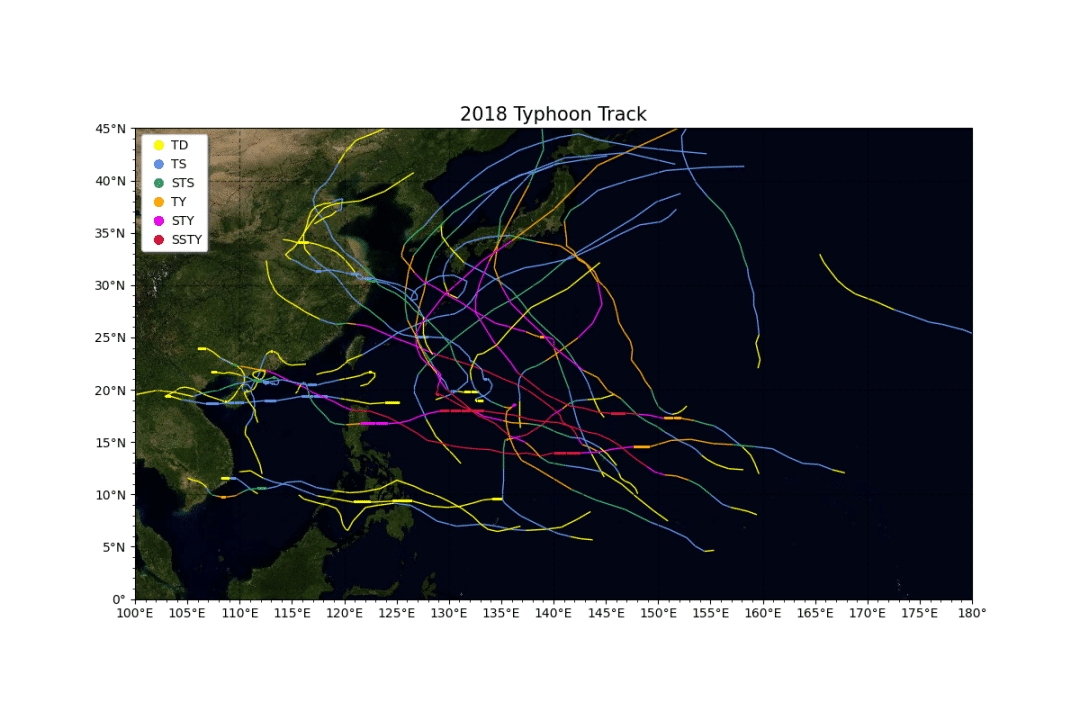
定义绘制单个台风gif路径演变方法,并绘制2018年第18号台风的gif路径图。
def draw_single_gif(df):
  for state in range(len(df.index))[:]:
    ax = create_map(f'{df["名字"].iloc[0]} {df["时间"].iloc[state]}', [110, 135, 20, 45])
    for i in range(len(df[:state])):
      ax.scatter(df['经度'].iloc[i], df['纬度'].iloc[i], marker='o', s=20, color=get_color(df['强度'].iloc[i]))
    for i in range(len(df[:state])-1):
      pointA = df['经度'].iloc[i],df['纬度'].iloc[i]
      pointB = df['经度'].iloc[i+1],df['纬度'].iloc[i+1]
      ax.add_geometries([sgeom.LineString([pointA, pointB])], color=get_color(df['强度'].iloc[i+1]),crs=ccrs.PlateCarree())
    print(f'正在绘制第{state}张轨迹图')
    plt.savefig(f'./{df["名字"].iloc[0]}{str(state).zfill(3)}.png', bbox_inches='tight')
  # 将图片拼接成动画
  imgFiles = list(glob.glob(f'./{df["名字"].iloc[0]}*.png'))
  images = [Image.open(fn) for fn in imgFiles]
  im = images[0]
  filename = f'./track_{df["名字"].iloc[0]}.gif'
  im.save(fp=filename, format='gif', save_all=True, append_images=images[1:], duration=500)
draw_single_gif(df[df['编号']==1818])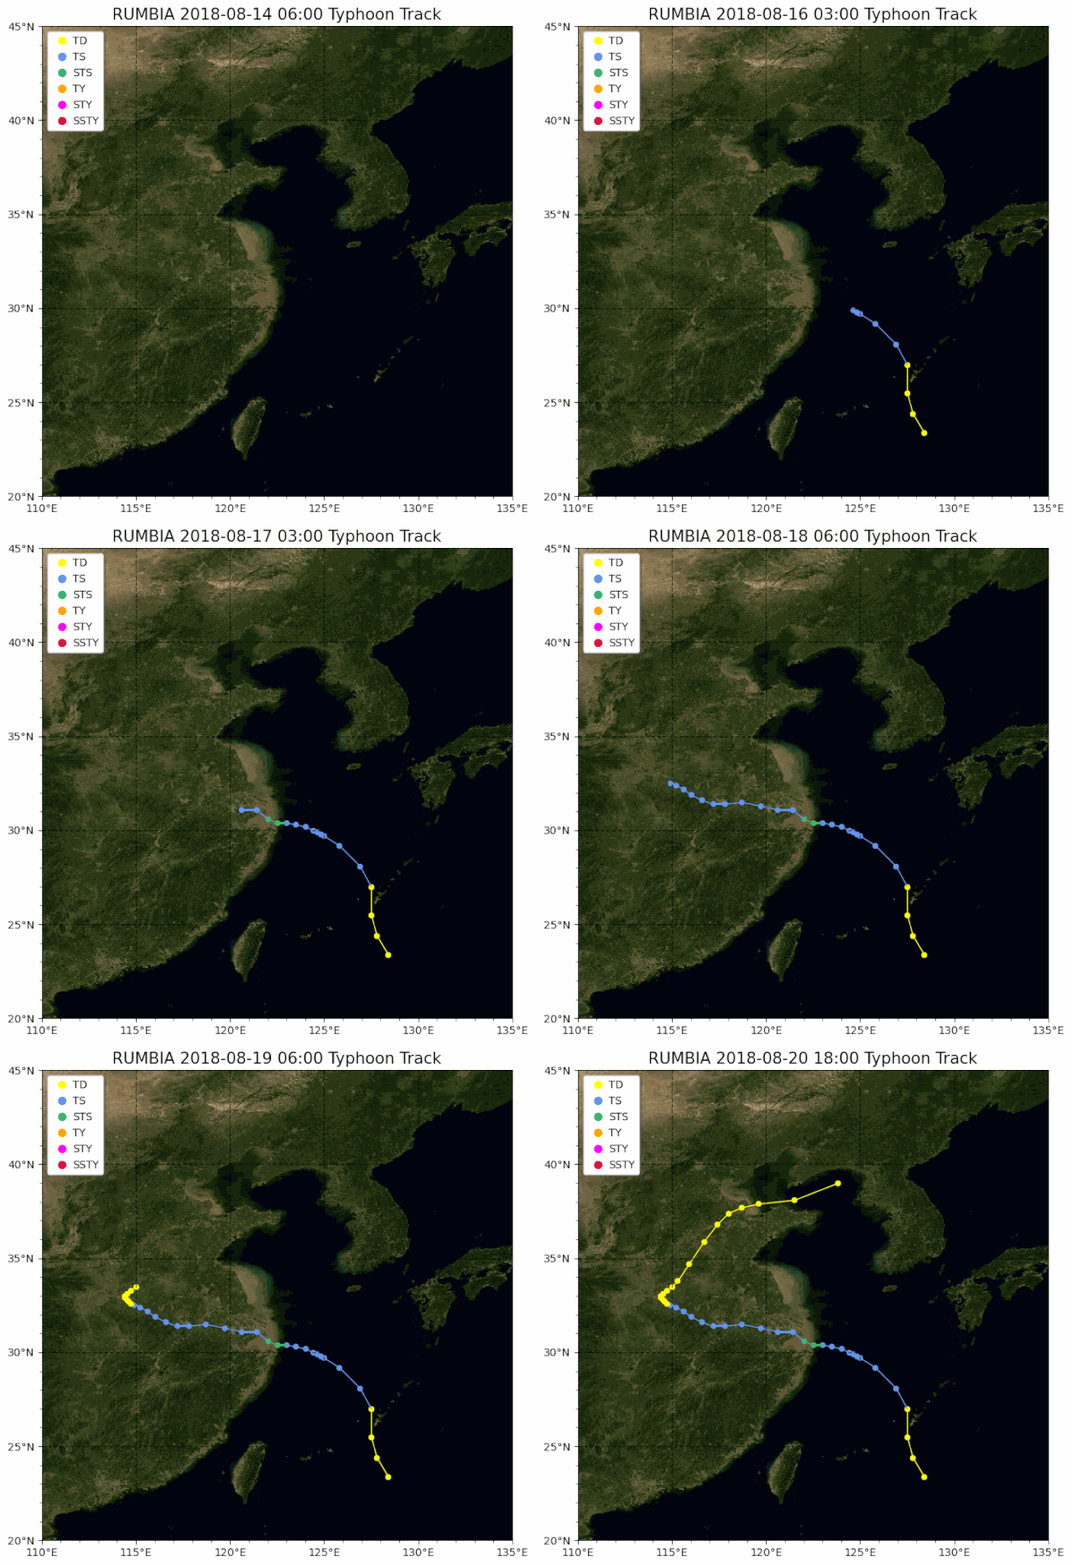
相关内容
热门资讯
空调连续工作多久需要停机休息
空调连续工作的时间取决于多个因素,包括空调的型号、功率、使用环境和维护情况等。一般来说,空调可以连续...
空调哪个符号是除湿的
空调除湿功能通常用一个水滴形状的符号表示。不同品牌和型号的空调遥控器可能会有所差异,但一般来说,除湿...
格力空调多长时间加一次氟利昂
1、一般情况下,空调对氟利昂的使用量是非常小的,所以在空调使用了四年左右的时候再考虑加也没问题。2、...
空调用多长时间需要加氟一次
一般情况下是五年。当出现以下这几种情况时,空调才需要加氟。1、空调的室内机和室外机各有两个接口,当接...
格调生活·C标思享荟:卡萨帝在...
9月12日的郑州龙湖金融岛,夜风轻拂,灯光璀璨。“C标时刻共传奇——卡萨帝思享荟暨20周年品牌盛典郑...
品牌价值破千亿、高端份额持续领...
9月12日,“C标时刻共传奇——卡萨帝思享荟暨20周年品牌盛典郑州站”在郑州龙湖金融岛举办。2026...
空调主板坏了修800还是换新的
空调主板坏了是修还是换新,需要考虑多个因素,以下是一些建议:1. 维修成本:如果维修费用较低,比如 ...
空调开多久需要休息多长时间
问题:空调开多久需要休息多长时间回答:1、在使用空调的过程中,一般空调开7~8个小时左右需要休息2~...
中央空调多长时间清洗一次
1、一般空调开机前清洗一次即可,空调开机中间时段再清洗一次,空调关机时清洗一次,这样比较合理。2、空...
中央空调氟利昂多久加一次
看空调制热和制冷程度,很多人的观点认为氟利昂必须一年放一次,其实这个观点是错误的,理解上面有点偏差,...